Six Deck Blackjack
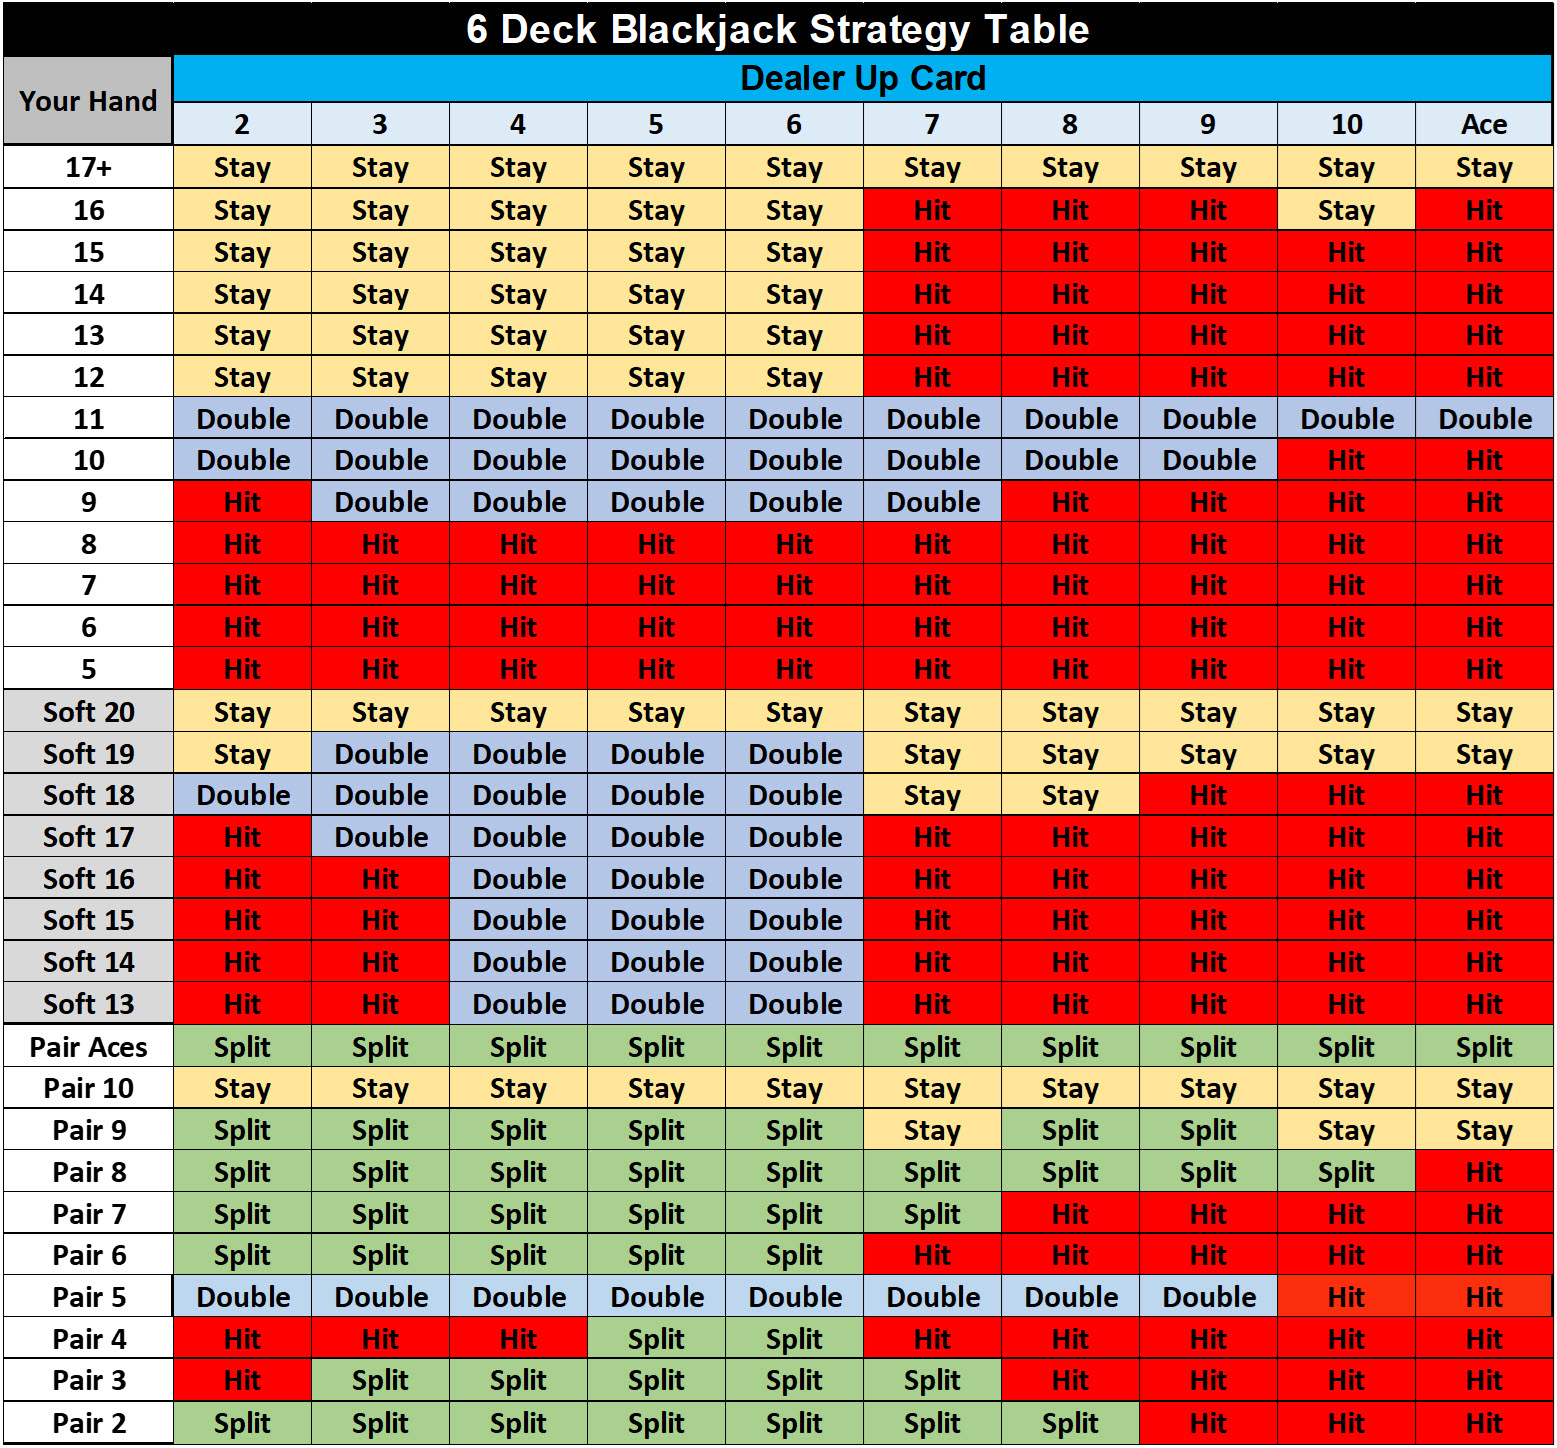
 Since the original analysis of Blackjack in April 2021 the software has been optimized for speed and can play over 51,000 hands per second, making it much quicker to determine results with a larger sample size. Over one billion hands were analyzed to arrive at the results for 6-Deck Blackjack. Since many hand combinations don’t occur very often (a Player Pair of 2s versus a Dealer 2, for instance), a system for acquiring equal sample sizes was developed where previously we relied on a large number of Hands and took what we got in terms of matching criteria for a test. There’s also a greater emphasis on the Bank. To borrow a phrase made famous by NASA, our “confidence is high” that this table affords you the highest probability of winning. We’re putting a copy of it here at the beginning of the analysis because that’s all many people want. For the rest, continue reading for the Why behind the table.
There are three basic categories of Hands: Hard (no Ace) Decision Hands, Soft Hands, and Pairs. We'll look at each category separately.
Decision Hands
The first two cards you’re dealt in Blackjack set the stage for how the rest of the hand will go, everything from the namesake Blackjack to the despised 16. The Decision Hands are the hands where you need to decide whether or not to hit. While all hands are technically Decision Hands, unless you get a wild hair you’ll always Hit an 11 or less, and you’re never going to hit a Hard 17 or higher, leaving the Player hands of 12 to 16.
Basic Decision Hands
The possible Dealer Up Cards are always 2 – Ace, and for the Basic Decision test we looked at Player Hands of 12 – 20. Assuming that you’ll always hit an 11 or less, eventually 100% of the player’s hands will have a value of 12 - 21, and I’ve never seen anyone hit a 21. You wouldn’t Hit a 17 or higher but we did it in our test because we could (at no cost). We played hands until we obtained 5,000 samples of each combination, 900,000 Samples total. This is the equivalent of playing Blackjack as a full-time job for a year and half. Soft Hands and Pairs were ignored.
This was done twice. The first time we stayed on all Hands and this was the control group. The second time, every hand was hit. Once a Hand was Hit, whether or not it was Hit again was determined by the 8-Deck Decision table which would Hit less than 17 against a Dealer 7 or better, otherwise Stay (the 8-Deck Table only Hits a 12 against a 2, all other Hands less than 17 Stay against a Dealer 2 – 6).
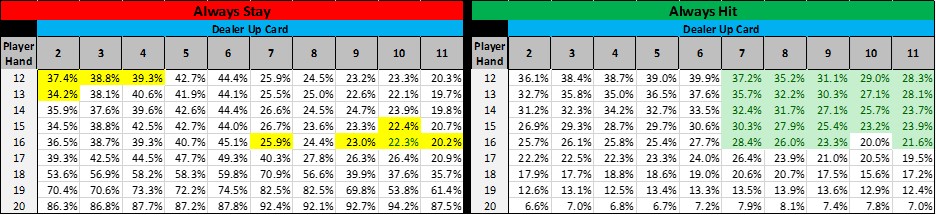
The combinations highlighted in yellow under “Always Stay” were NOT statistically significant. More on that later, but essentially it means that for those combinations, it doesn’t matter whether you Hit or Stay. The combinations highlighted in green under “Always Hit”, indicate the hand should be Hit, all others should Stay.
- Hit or Double Down (that’s later, also) all hands 11 or less
- Stay on 17 or higher
- Stay against a Dealer 2 – 6
- Hit a 12 - 16 against a Dealer 7 or better, except don’t Hit a 16 against a 10
Not hitting a 16 against a 10 is the reason the sample size grew to 5,000 for each combination. It was originally 1,000, and the test was run multiple times, and Staying against a 9, 10, or Ace with a 16, or Hitting a 14 against a 2 kept coming up, and the results didn’t pass the sanity test. The sample size eventually grew to 5,000 (the larger the sample size, the more confident we are in the results). Hitting a 2 against a Dealer 2 came up frequently, just not in the final run with 5,000 samples.
We can glean some other insights from this table. With Player Hands of 12 – 17 the Dealer must bust in order for the Player to Win. The Winning percentage for those Player Hands and a Dealer Up Card of 2 - 6 averages 40.9%; 23.4% with an Up Card of 7+, and 32.6% overall, with the Dealer busting more frequently as the Up Card gets closer to 6.
- 20 Wins 89.5% of the time (76.5% including Pushes) and the Winning percentage is higher with Dealer Up Cards of 7 – 10 (92.8%)
- 19 Wins 71.1% of the time (60.5% with Pushes), and only Dealer 7s and 8s exceeded 80%
- 18 barely makes it into positive territory with 52.7% of the Hands Winning (44.9% with Pushes)
- 17 is not a good Hand, winning only 36.5%
- Player Hands of 12 – 16 only Win 33.5% of the Hands using the Decision Table above
Soft Hands
Soft Hands have three options:
- You can Stay
- You can treat the Ace as a 1 and play the hand like any Hard Hand
- You can Double Down
The Bank was tracked to determine the best option in a given scenario and 5,000 Samples were gathered for each option.
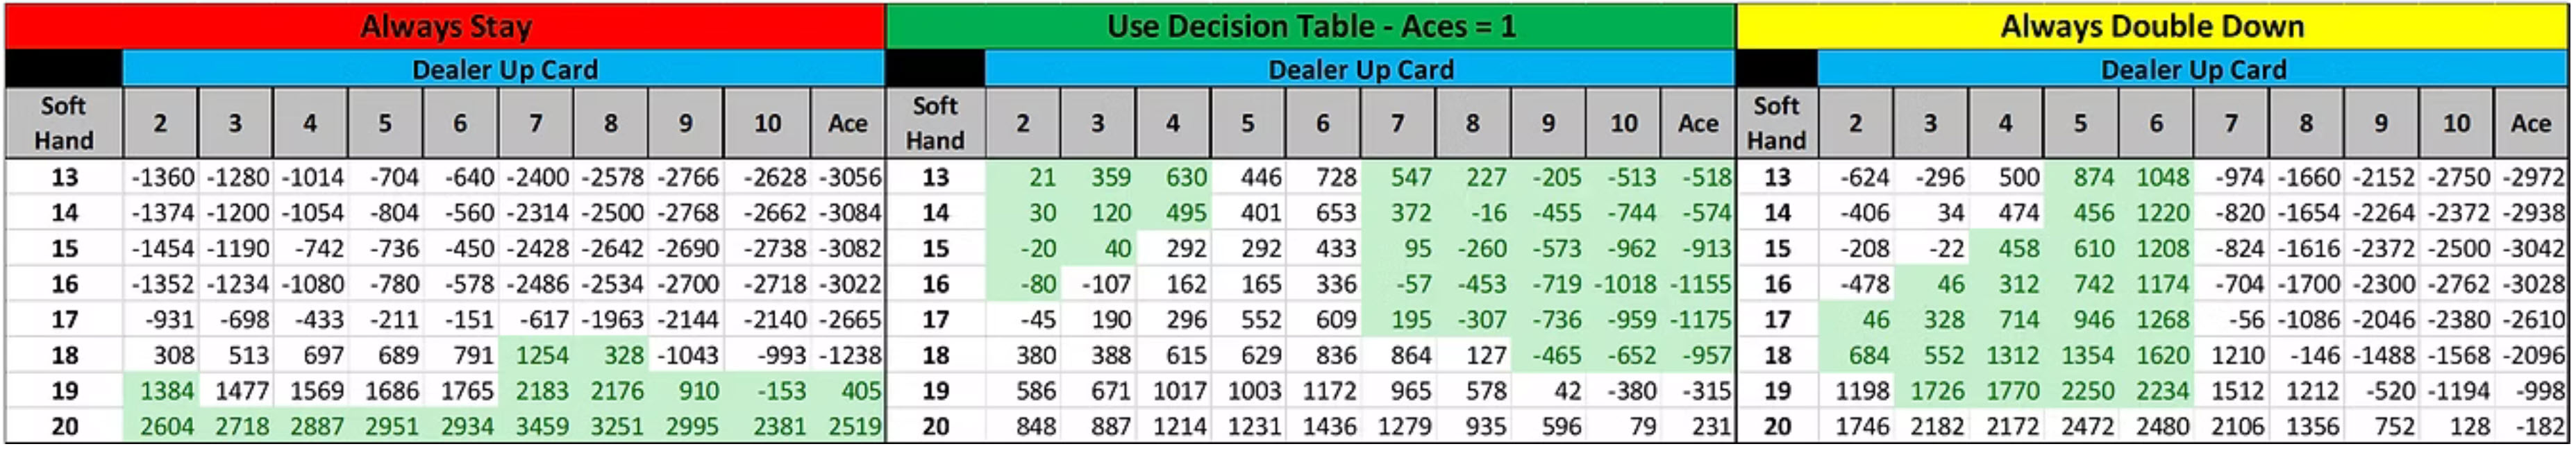
It’s a little confusing because of the 3-Way interaction and the results are more aggressive than the 8-Deck table. The biggest difference is Doubling a Soft 19 against a Dealer 3 – 6. Again, the recommended action for each combination is highlighted in green.
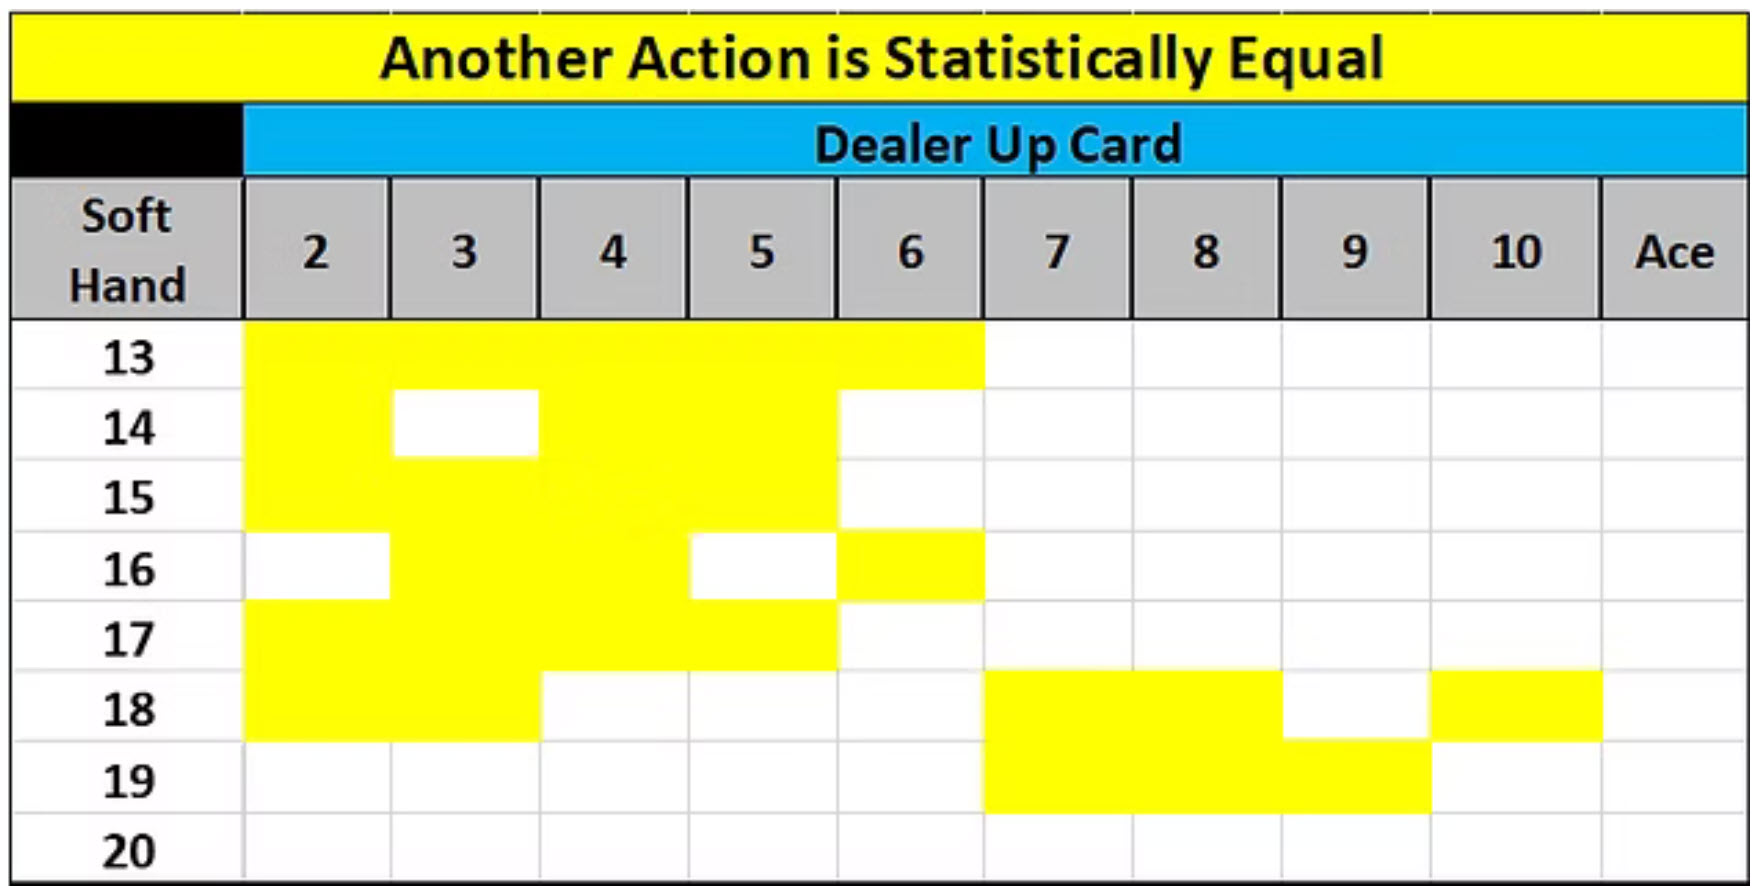 Twenty-seven of the eighty combinations were statistically equal to at least one of the other options. The just mentioned Doubling of Soft 19s weren’t in that group. Most of them are at the low end of the range, the 13s to 15s against 2s to 4s, which had very wide Confidence Intervals due to outliers, and half of the Soft 18s are equivalent to another choice. Staying on 20 was significant against all Dealer Up Cards.
Splits
We ran 5,000 samples of each combination for the Splits also. The Net Bank was used to determine the best course of action with Splits. Only three Splits are allowed (for a total of up to four hands). Roughly 6% of Split Hands were Split again. The number of times each combination comes up is small, particularly if the combination matches the Player’s Pair with the Dealer Up Card. Because we only track one combination at a time in order to minimize the effects of Splitting/Staying on the rest of the Shoe. 1,031,075,262 Hands were played to obtain the Samples. The odds for the various combinations are:
- Pair Ace to 9 with matching Up Card: 1 in 425
- Pair 10s with matching Up Card 1 in 37
- Pair Ace to 9, different up card: 1 in 15
- Pair Tens, any Up Card 1 in 11
The odds of getting a specific Pair with a matching Up Card are 1 in 3,252 and was part of the reason so many Hands were played to get the required Samples.
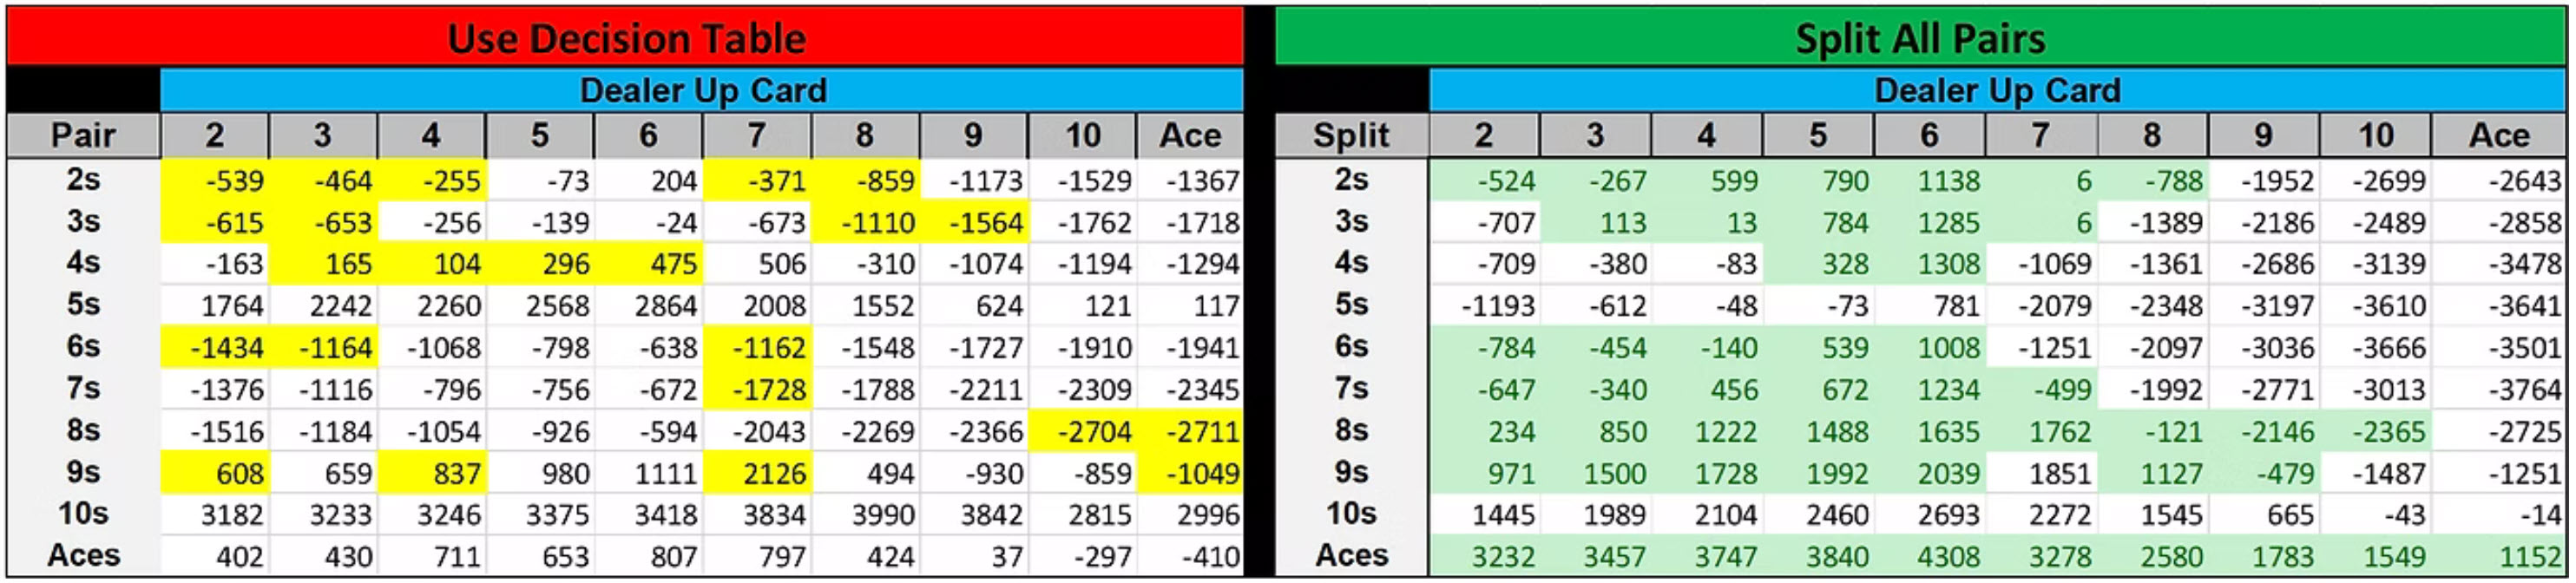 There were only a few differences from the 8-Deck table and the differences were minor, certainly nothing that would make a Dealer say, “Are you sure?”
- 2s should be split against a 2 – 8, not 2 – 7
- Split 3s against a 3 – 8, not 2 – 7
- 8’s should be split against everything except an Ace
Doubling
Double Downs and Splits are the way you change the Casino’s advantage from about 8%, to 0.5%, the best odds in the house. According to the 8-Deck Table, nothing below a 9 or above an 11 are candidates for Doubling. We’ll expand the range to 8 – 12 (particularly since many people think Doubling a 12 is a good idea) and determine the action with the highest probability of Winning. There are two options with these hands, Hit or Double. If the option being tested is Hit, a card was taken and the total of the three cards was then played according to the Decision Table. If the option being tested is Double Down, there’s no option to take another card. 5,000 Samples of each combination were gathered (136 million Hands were Played to gather the samples).
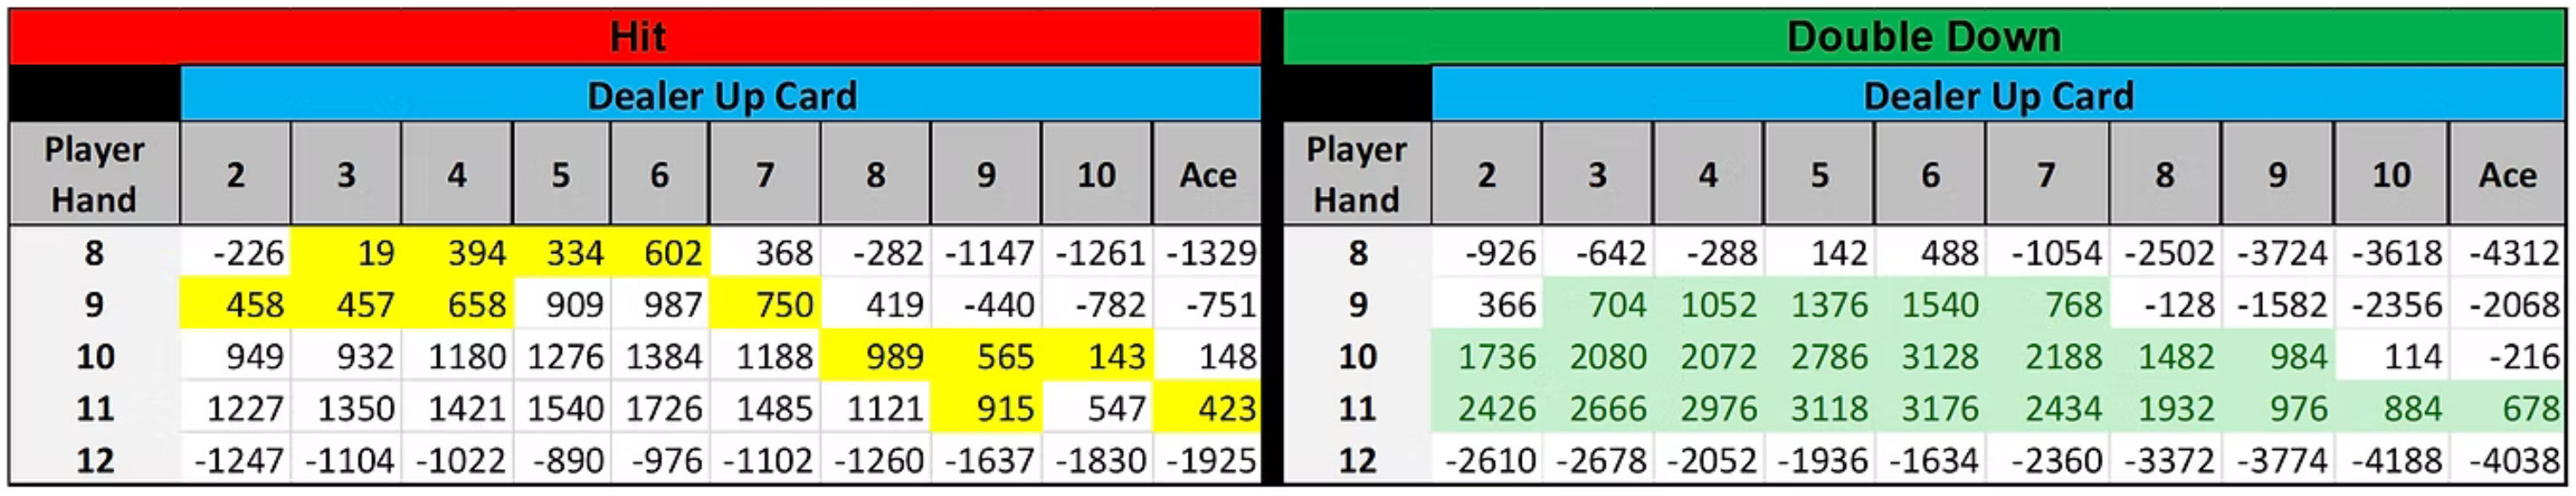
Again, the combinations that were NOT statistically significant are highlighted in yellow. The Double Down Table for a 6-Deck shoe is almost the same as the 8-Deck Table. The one difference being Doubling a 9 against a 7. Doubling on a 12 ensures that the only thing you’re Doubling are your Losses and there’s no combination in which Doubling with an 8 is better.
- Double all 11s
- Double 10s against a Dealer 2 – 9
- Double 9s against a 3 - 7
Odds, Probability and Confidence Intervals
This is a good time to discuss the statistical concepts of odds, probability, and Confidence Intervals (CI). We can talk about how the odds of not busting when hitting a hard 16 are 38.5% (five out of 13 cards that won’t bust). That’s better than 1 in 3. If you’ve busted 20 times in a row, On the 21st try the odds of busting are still 61.5%, but the probability of busting is significantly lower. And what really matters is whether you’ll win the hand. You can draw a 3 to go with your 16, but if the Dealer has a 20, you still lose, and you would have lost anyway if you’d stayed.
Statistical analysis recognizes that since your test sample isn’t all of the hands that you will ever play, there’s a “Margin of Error” when calculating the average (mean) winning percentage. You frequently see the Margin of Error, or Confidence Interval (CI), accompanying political polls. They’ve asked a group of people who represent the overall population who they’re going to vote for and predict the results based on the group they polled. If they could have polled all of the voters their results might be different, and the Margin of Error is the potential difference between the results within their group, and the voters on election day. If the Margin of Error is greater than the spread between two candidates, the race is considered a toss-up. Same with Blackjack. If the CI for Hitting a hand overlaps the CI for Staying, statistically they’re the same.
The Confidence Level indicates How confident you are in the analysis and is expressed as a percentage. A 95% Confidence Level is the usual level for all kinds of business and scientific analysis, including political polls and studies for the efficacy of vaccines. We used 95% for our Blackjack analysis. The reporting format for reporting Confidence Levels and Confidence Intervals is normally in the form of:
“95% CI (0.215, 0.254)”
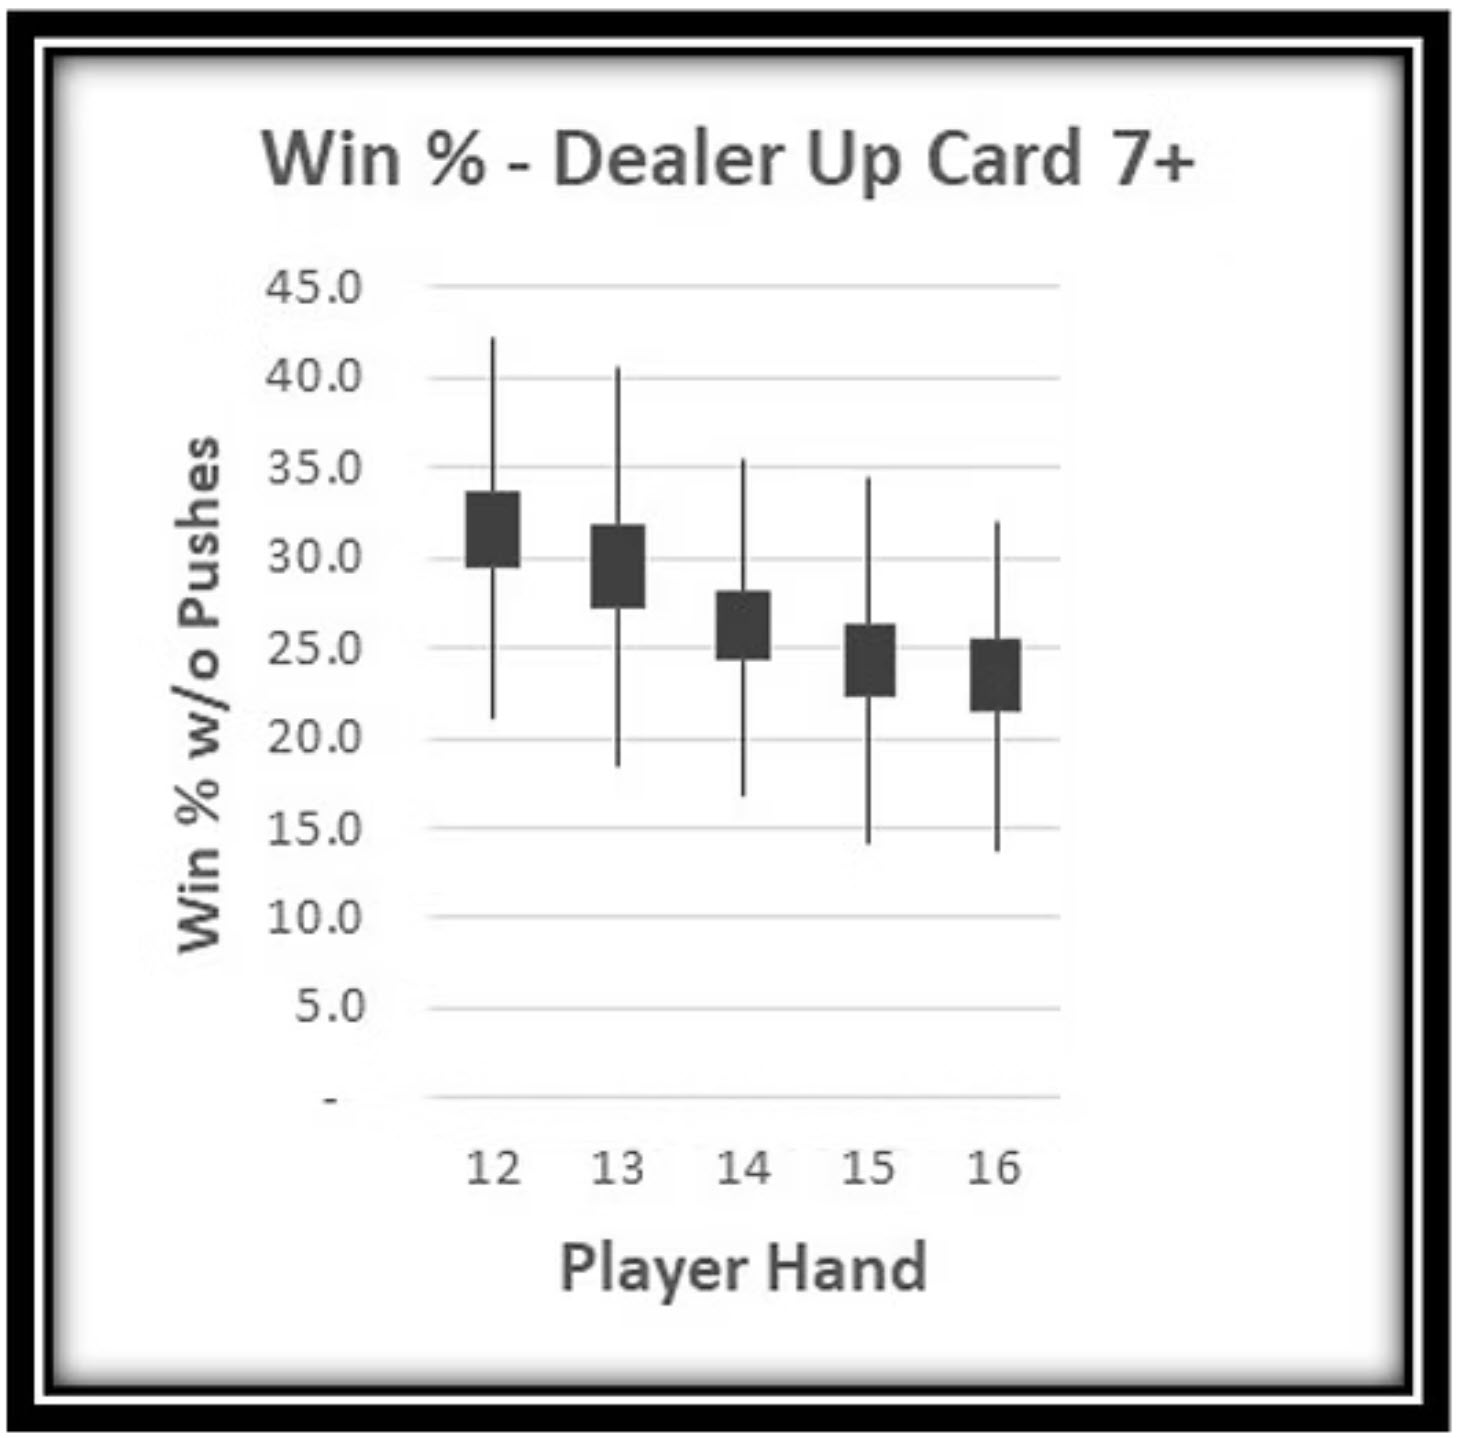 This indicates that I’m 95% confident that if we could sample all of the hands of Blackjack that will ever be played, the actual average winning percentage for Staying on 16s will be between 21.5% and 25.4%. The calculated range of ±1.9% is subtracted from the Mean (23.4%) to arrive at the Lower Statistical Limit (LSL) and added to the mean to get the Upper Statistical Limit (USL). It’s important to note that if the LSL/USL of one sample overlaps with the LSL/USL of another sample, then there is no statistical difference between the two samples. It’s easier to see in a graph like the one on the left. The boxes are the CI and overlap between a 12 and 13 which means the difference is statistically insignificant, but a 12 doesn’t overlap with 14 – 16, meaning that the difference between a 12 and 14 – 16 is statistically significant. The whiskers are the high and low in the sample.
Having said all of that, we’re going to go with the average (mean) as calculated to determine our course of action in any given situation. We’re not going to dwell on Confidence Intervals and Statistical Control Limits. We know there’s a range surrounding the averages and beyond showing which ones are insignificant, we’ll leave it at that.
The Result
The table that comes from the testing (at the top of the page) would be considered slightly more aggressive than the original 8-Deck table, but nothing to raise eyebrows.
To see how this ends up, we ran 100 sets of 400 hands each, 5 times, then took the middle run based on the ending bank balance to use as our example:
- 40,000 Hands Dealt
- 1,111 Splits for a total of 41,111 hands played
- 4,485 Doubles
- With Splits and Doubles, 45,596 was wagered
- The Ending Bank was -366 for a Win/Loss Percentage of -0.8%
- The Ending Bank Balance range was from -64 to +62
- The Average ending Bank Balance for 400 Hands was -6 (95% CI (-8.29, 0.97))
- 43 Sets Won, 54 Lost, and 3 broke even
Converting the -366 ending Bank Balance to dollars, a bet of $15 on every Hand would have resulted in a loss of -$5,490 over the course of our 40,000 hands. A $25 bet would have lost us -$9,350.